Technical trading is a powerful method used by many experienced online stock traders. However, the idea of trading the stock market using charts and indicators doesn’t always make sense to new traders. A close look at what actually takes place in the “real world,” makes it easy to see how price and volume action on a stock chart reveals more information than most people would ever imagine. Technical trading stocks online Like thermal imaging, technical analysis converts price action into useful graphics.
Let’s start with the concept that sooner or later all news and fundamentals about a company are reflected in the stock price. The stock market accomplishes this process relatively fast, especially now that so many investors are going online for information.
Company insiders are the first to know when events are underway that will impact the company’s stock – THEIR stock. Although SEC regulations do govern what insiders can say and do with the information they obtain, the fact remains that people do talk.
What starts out as quiet chatter among key employees soon spreads beyond the company’s inner circle. These conversations quickly make their way to friends and acquaintances, who in turn share this exciting news with others.
As more and more people hear about these “secrets” many will either buy or sell the stock to take advantage. As a result the stock chart begins to signal that something significant is taking place.
Serious chart readers learn to recognize the signs of change. They watch closely to see if an opportunity exists to profit from the developing situation. This group includes what is commonly referred to as “smart money,” traders with deep pockets who recognize what is going on and take action. Due to the size involved, their stock trading always shows up on the charts.
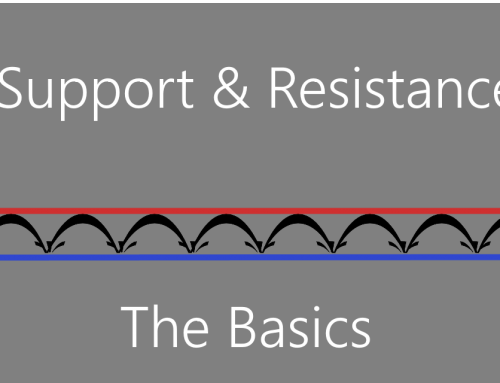
Also involved in this process are approximately 4000 “semi pros,” who according to CNBC, make up over 80% of the total daily online stock market trading volume. They are extremely active, trading an average of 50 times each session. Their days are spent banging into support and resistance levels to see what, if anything, gives.
After reading the strength of these pivotal chart areas, they quickly decide to either hold onto their stock positions, or reverse and head in the other direction. In one sense they play the role of stock market “scouts” who push and pull at any possible weakness to find which direction prices are willing to go.
These ever-active players are also the oil that lubricates the stock market online trading machine. They create constant price movement at the same time other less-active groups are sitting on the sidelines. It doesn’t take long for the impact on price and volume draws patterns on the charts. These are powerful clues about where a specific stock – and on a larger scale the entire stock market – is ultimately headed.
Bottom line? Anyone trading the stock market online should take note that charting works effectively in all markets in all time frames. This applies to short-term trading and long term investing alike.
There is nothing new about all this. It has been known among technical analysts for decades. Those of us who use charts as part of our online stock trading strategy locate the pivotal levels, then go with the flow along with the intelligent money. While it does take effort to learn, this is certainly one skill that anyone trading the stock market should acquire!