A Moving Average (MA) is a simple tool that smooths out price data by creating a constantly updated average price. The average is taken over a specific period of time that the trader chooses. Most moving averages are based on closing prices. For example, a 5-day simple moving average is the five-day sum of closing prices divided by five. As the name implies, a moving average is an average that moves. The oldest data is dropped as new data becomes available, which causes the average to move along the time scale.
There are advantages to using a moving average in your trading, as well as options on what type of moving average to use. Moving average strategies are also popular and can be tailored to any time frame, suiting both long-term investors and short-term traders.
As veteran RightLine readers know, we tend to favor a technical approach to trading stocks. The reason is simple: the twists and turns of shorter-term swing trades can be more accurately gauged by technical aspects that the typical investor is unaware of.
There are numerous ways to apply technical analysis. A whole universe of indicators and oscillators are at our disposal. Some traders even create new ones based on their observations. While there is certainly nothing wrong with in-depth analysis, too many indicators can obscure the most important aspect of a stock’s movement – its price action.
Moving averages can be thought of as dynamic, flexible trend-lines that follow an equity’s price. A simple trend, connecting two or more relative highs/lows, is one of the easiest technical concepts to grasp. However, these have a major limitation: they don’t adapt to price changes.
The solution is to create a trend that incorporates daily price changes. Moving averages do exactly that. Take the “50 DMA” for example – the 50-day moving average. This indicator averages out the trading price for the previous 50 days. It’s also constantly updated during the trading day, creating a constantly moving line on the stock chart.
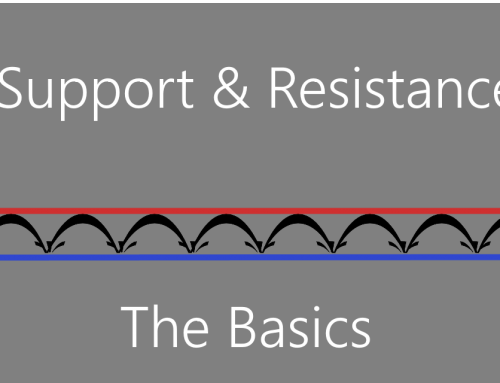
The most useful aspect of moving averages is the fact that they often provide either support or resistance. This is especially helpful in market climates – much like the one we’re seeing right now – when many stocks are moving to long-term or historical highs. With well-established trend-lines left in the dust, the moving averages provide a logical rebound target during pullbacks.
Moving average crossovers are another way to apply the indicator. When an MA with a shorter period crosses an MA with a longer period, a directional change could be underway. One of the most useful crossovers is the 50/200. These two key moving averages, with their longer-term timeframes, tend to be reliable. If the 50 DMA rises through the 200 DMA, more upside could be in store. The inverse in true when the 50 DMA descends through the 200 DMA.
While moving averages are typically used on daily intervals, they can also be applied to other timeframes to provide helpful charting roadmaps. Weekly charts often show interesting correlations – for example, a long-term uptrend might feature repeated bounces off the 22-week MA. Daytraders can also use the same techniques, applying MA’s to intra-day intervals.
These colorful lines on the charts offer an endless stream of trading opportunities.


