In almost every issue of the RightLine Report we refer to support and resistance levels. Indeed, many of our stock entry points are based on potential price reactions to these important junctions. So just what are support and resistance levels, and why are they so important?
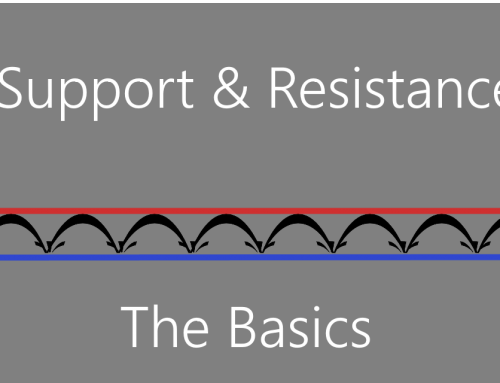
In the book “Trading For A Living,” Dr. Alex Elder gives a simple, but effective image of support and resistance – “A ball hits the floor and bounces. It drops after it hits the ceiling. Support and resistance is like a floor and a ceiling, with prices sandwiched between them.” When a stock’s price has fallen to a level where demand at that price increases and buyers begin to buy, this creates a “floor” or support level. When a stock’s price rises to a level where demand decreases and owners begin to sell to lock in their profits, this creates the “ceiling” or resistance level.
Why? Because investors and traders are people and they have memories! Those that follow a particular stock just “know” that it “never (or rarely) falls below xx” and it “never rises above yy”. The “floor” and the “ceiling” are not fixed barriers you can touch; rather they are psychological barriers. These psychological barriers are built when traders who bought the stock at the “ceiling” are grateful to be able to get out of their positions and just break even. They were beating themselves over the head from the day they bought it, swearing they will never be so “stupid” again, and praying that they can just get out without losing their shirts.
How To Recognize Support and Resistance
You can identify support and resistance levels by studying a chart. Look for a series of low points where a stock falls to this level, but then falls no further. This is a support level. When you find that a stock rises to a certain high, but no higher, you have found a resistance level. If you find yourself struggling to find the support or resistance levels, then those levels may be not be very strong.

Strength of Support or Resistance
The more times that a stock bounces off support and falls back from resistance, the stronger these support and resistance levels become. It creates a self-fulfilling prophecy. The more often it happens, the more likely it is to happen again. The more those historical patterns repeat themselves, the more traders “know,” and the more confident they become in forecasting the future behavior of the stock. Some stocks become so entrenched in this trading range, that the stock eventually has a hard time breaking through the levels to either the up or downside.
Using Support and Resistance
Long traders will often set a stop slightly below one of the support levels, and short sellers will often set their stops just above resistance. The reason for these stop levels is because investors “know” that historically; these price points are unlikely to be violated. When either of these points is exceeded to the point that stops go into effect, then there is the potential for a powerful price move as automatic buying or selling is set into motion by the stops being triggered.
Trading Ranges
A long-term pattern of a stock’s price bouncing between support and resistance levels creates what we call a trading range. Although most charts don’t show a predictable pattern, many do. If you find a stock that consistently trades in a range, this may be a good opportunity to benefit from the predictable movement in the stock.
The best way to trade a “rolling stock” or “channeling stock” is to buy just after you start to see the bounce off support and sell just after you start to see it drop back off resistance. Notice that you should wait to see the beginning of the “expected” action before pulling the trigger. Many traders get in the habit of buying or selling before they actually see the stock bounce or fall, hoping to sell at the peak or buy at the low. What these traders risk is that the stock will not do what they expect it to do. By waiting to see the reversal, a trader may give up a small amount of profit, but they will also avoid the risk of selling just before a stock breaks out to the upside or buying just before a stock falls to the downside. There are many range-bound stocks that long-term “buy and hold” investors have sat on for month after month without making any money; on the other hand, the “channel surfer” has made a decent return by buying near the bottom of the pattern and selling near the top. Not all stocks are candidates for this type of trading, but you will see them from time to time.
Breakouts
We’ve all seen charts of stocks that traded in a range for a time, and then bust through resistance to shoot effortlessly higher. Why does this happen? Recall that the more times a stock hits a support or resistance level, the “stronger” that level apparently becomes. Being astute traders we just “know” that a stock’s price is unlikely to exceed a strong resistance level. The more of us that recognize that fact, the more short sellers there are likely to be lining up to short the stock. And the more short sellers there are the more buy stops there will be set at that “unlikely” level.
But, let’s say the stock receives a strong recommendation from three analysts who feel the stock is a “strong buy.” The result? Demand for the stock goes up, short sellers are “squeezed” out as they are stopped out and are forced to buy the stock to cover their short positions, creating what we affectionately term a “short squeeze.” Everyone who thought they knew where the ceiling (resistance) was, no longer holds a position in that stock. What once was the ceiling becomes the new floor, or support level.
Once a stock breaks out above strong resistance, it takes some time to create and recognize the new ceiling. Short sellers become less likely to step in because they can no longer anticipate where the stock is likely to “bounce back down.” RightLine readers are familiar with the term “blue-sky territory” or “blue-sky breakout.” We use the term blue-sky to indicate when a stock breaks above all previous resistance points.
Breakdowns
Just as support can be considered the opposite of resistance, the phenomenon just described as a breakout can also occur to the downside. This is what we refer to as Breakdown. Traders who own a stock long will often have stops set just below significant support levels. If these support levels are broken, traders will be stopped out if the stock falls below support. The increased selling volume will normally cause a quick and decisive drop in the stock because those buyers who “knew” the floor (support) level, are now are out of the stock, leaving very few buyers until the stock hits the next level of support.
50 DMA Support Level
Before wrapping up this discussion, we want to draw your attention to the fact that many technical analysis packages are programmed with 50 DMA (Daily Moving Average) rebounds in mind. Though the behavior of each stock is unique, you will often see that as a stock falls to near the 50 DMA, buyers come in, reversing the downtrend and causing the stock to “bounce.” By reviewing a few dozen stocks, you will notice that some stocks have a very predictable pattern of bouncing off support at the 50 DMA. While you won’t find this same pattern among all stocks, when you do find it, it can be quite valuable. Just as in the case when traders “know” the trading range of a stock is stuck between lateral support and resistance levels (trading range or channel), they will also look to the 50 DMA to provide an indication of support. We see this happen especially on strong, trending stocks. Pre-programmed technical analysis packages have the 50 DMA built in, creating an even stronger tendency for a self-fulfilling prophecy. Many of the stocks covered in the Right Line report tend to find support at their 50 or 22 DMAs.
Understanding the concept of support, resistance, trading ranges, breakouts and breakdowns can be quite valuable to all traders. Support and resistance is the one of the strongest and most dependable tools available to the trader glavna stranica. Remember that it is best to use any tool along with other indicators when deciding whether and/or when to take or exit a position.